It is the beginning of another week, and you don’t know how your team will possibly be able to support the financial needs of all your schools’ stakeholders. You...
It is the beginning of another week, and you don’t know how your team will possibly be able to support the financial needs of all your schools’ stakeholders. You wish you had more staff (not going to happen), and so you wonder what you can do? When I worked in a school, I constantly struggled with how to meet the financial needs of the principals, administrators, finance committee members, board members and department managers and still make it to my evening pickleball game!
If you have the same issues, even if you don’t play pickleball, you can use Sage Intacct to automate your financial reports and dashboards. With these self-service dashboards, users can see the financial information they need to make data-driven decisions. You can restrict users’ access, so they only see the data they need to see. Principals can easily see how much money they have left in their budget, without seeing other schools’ budgets.
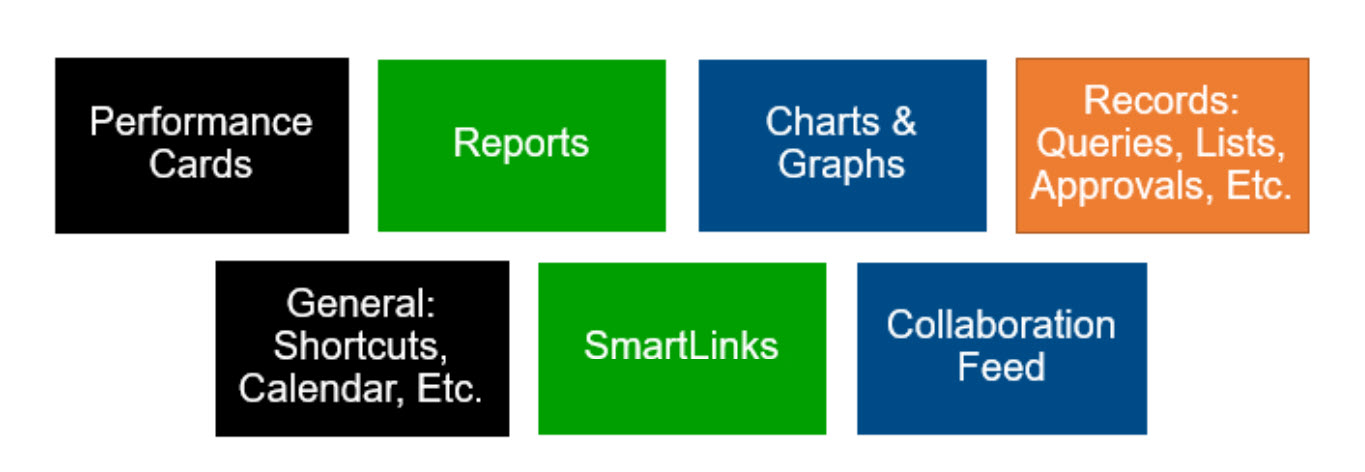
The building blocks for Sage Intacct dashboards are shown below.

In this blog, we will focus in on Performance Cards, Reports and Charts & Graphs.
Performance Cards
Performance Cards show a single value component, such as revenue, salaries or cash against a period, budget or computation. These computations can then be displayed on Performance Cards as shown below.

In Sage Intacct, you can use Statistical Accounts to track nonfinancial data such as student enrollment or employee headcount. This nonfinancial data can also be displayed on Performance Cards and can be used in computations such as Average Tuition per Student or Average Expenditure per Student.

Reports
Financial Reports such as Income Statement/Statement of Activities and Balance Sheet/Statement of Financial Position can be added to dashboards. You can easily see current YTD vs prior YTD or actuals vs. budget as shown below.

Like Performance Cards, Financial Reports can also display either stand-alone Statistical Accounts or calculations such as Expenditures per Student as shown below.

Charts & Graphs
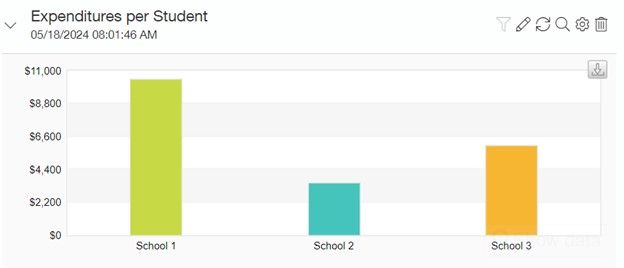
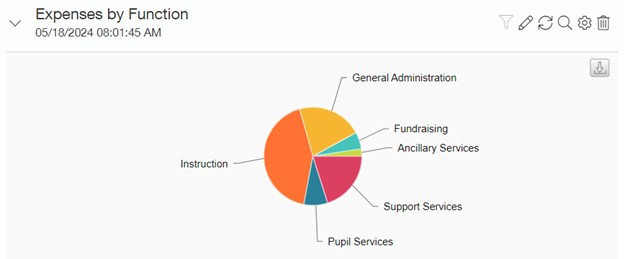
If you prefer to see financial data on a graph to visually compare between items such as schools, functions or fiscal years, graphs are also easy to add to dashboards.


Learn more about creating graphs for dashboards here.
Filtering Dashboards
One of my favorite parts of Sage Intacct dashboards is the ability to add filters for the date and up to three dimensions such as School, Department, Function or Grant at the top of each dashboard. Users can filter a dashboard on-the-fly and easily look at just the data for one school, department, or groups of schools, departments or other dimensions. The possibilities of different ways to slice and dice your financial data on dashboards with just the click of a button are endless. Since you can restrict users’ access, you don’t have to create a separate dashboard for each user. You can use filters and restrictions to enable each principal, for example, to see only their school’s data.
Dashboard Example
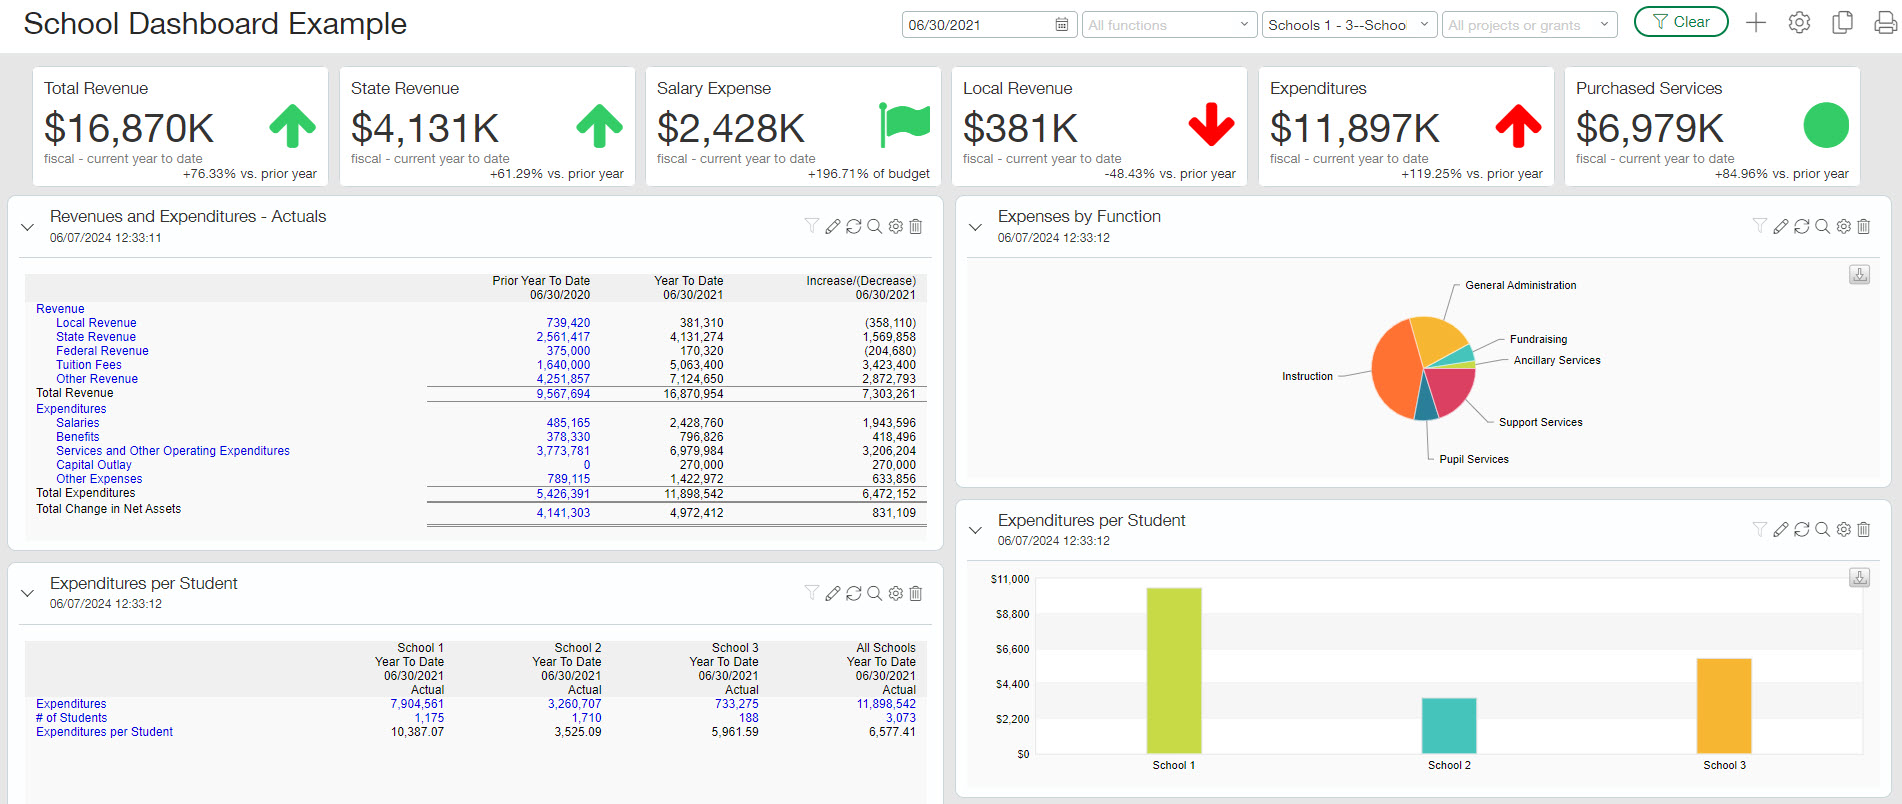
Once you design your dashboard components (Performance Cards, Financial Reports, Graphs, etc..), you have flexibility to organize the components on your dashboard. Here is an example of a dashboard that includes all three components.

With Sage Intacct dashboards, employees can make data-driven decisions with up-to-date financial information that they can easily access themselves. Automate dashboards with Sage Intacct and get back on the pickleball court, or wherever you like to spend your free time!
What’s Next?
Interested in learning more about Sage Intacct for schools? Reach out to us here!
Click below to register for our exclusive webinar on June 11th for the education sector, focusing on charter schools, independent schools, and higher education institutions. Discover how Sage Intacct’s sophisticated financial management solutions can streamline your accounting processes, improve reporting accuracy, and empower you to make data-driven decisions for financial excellence.
You can also check out our Sage Intacct Webinar Series and blogs below.
The post Sage Intacct for Schools: Data-Driven Decisions with Dashboards appeared first on Sage Blog.
