Accounting, historically, has focused on the past. Tracking revenue, expenses, statistical metrics, and the like through the most recently closed period and lever...
Accounting, historically, has focused on the past. Tracking revenue, expenses, statistical metrics, and the like through the most recently closed period and leveraging that data to make decisions and course correct when necessary. The goal, has been to make business processes as efficient (and accurate) as possible to supply decision makers with the closest to “real-time” information they need to make those decisions. As a result, the focus has been:
- Implementing business process efficiencies
- Expediting month-end close
- Access to real-time data
We can see examples of each of these within Sage Intacct. With its open API, seamless system integrations made moving data or duplicate data entry a thing of the past. With Revenue Recognition, monthly revenue recognition entries are posted automatically on a schedule while we sleep. Recurring Journal Entries have removed many sticky notes and reminders from our desks. Bank Feeds have made bank reconciliations a breeze, thus expediting month-end. With dashboards and reports, decision makers are a single click away from the latest financial data. No longer do you have to wait for month end close.
More recently, the accounting and finance profession seems to be focusing on digital technology trends in Artificial Intelligence, like Machine Learning, and Data Science. While ChatGPT might still take two tries to pass the CPA exam, we are now seeing Machine Learning applied to assist the finance professional through applications like GL outlier detection and assistant in Sage Intacct to ultimately lead to faster and more accurate real-time financials. Not only are we getting to a faster close, but we’re also leveraging data science in future predictions.
Recently, we covered how to combine reporting areas, AR, AP, and GL using SQL to create a Cash Forecast. This time, we’ll cover how Intacct Interactive Visual Explorer (IVE) uses SQL’s Forecast Seasonal ARIMA model to make predictions.
Before we get started, note: Intacct’s help which says it best “The data predicted from Interactive Visual Explorer’s forecast calculations are based on historical data and trends. Actual outcomes can differ from IVE’s calculated predictions.”
Applications
Besides predicting the mega-million lottery numbers, there are a lot of interesting applications for this type of SQL forecast:
- Statistical Data – taking the professional services industry as an example, wouldn’t it be nice if you could predict the number of projects that will close in the next few months based on historical data and trends?
- Revenue – what could you do if you knew forecasted revenue for product lines? Would it impact hiring decisions? Purchasing decisions? Pricing? If predictions showed a drop in sales due to seasonality or trend, could you circumvent that with a marketing campaign or sales promotion?
- Inventory – could you forecast inventory on hand and better inform purchasing decisions?
All this data already existing within Sage Intacct, makes it easy to leverage IVE to model these potential predictions. Let’s take a look!
IVE Forecast
In this example we’re looking at a professional services demo company. Within this company we’re keeping track of projects by the stage they are in. After a project is closed won, it is set up in Intacct in an Admin stage. This then automatically posts a statistical entry whenever a new project is added in an Admin stage or updated to a new stage automating statistical journal entries here).
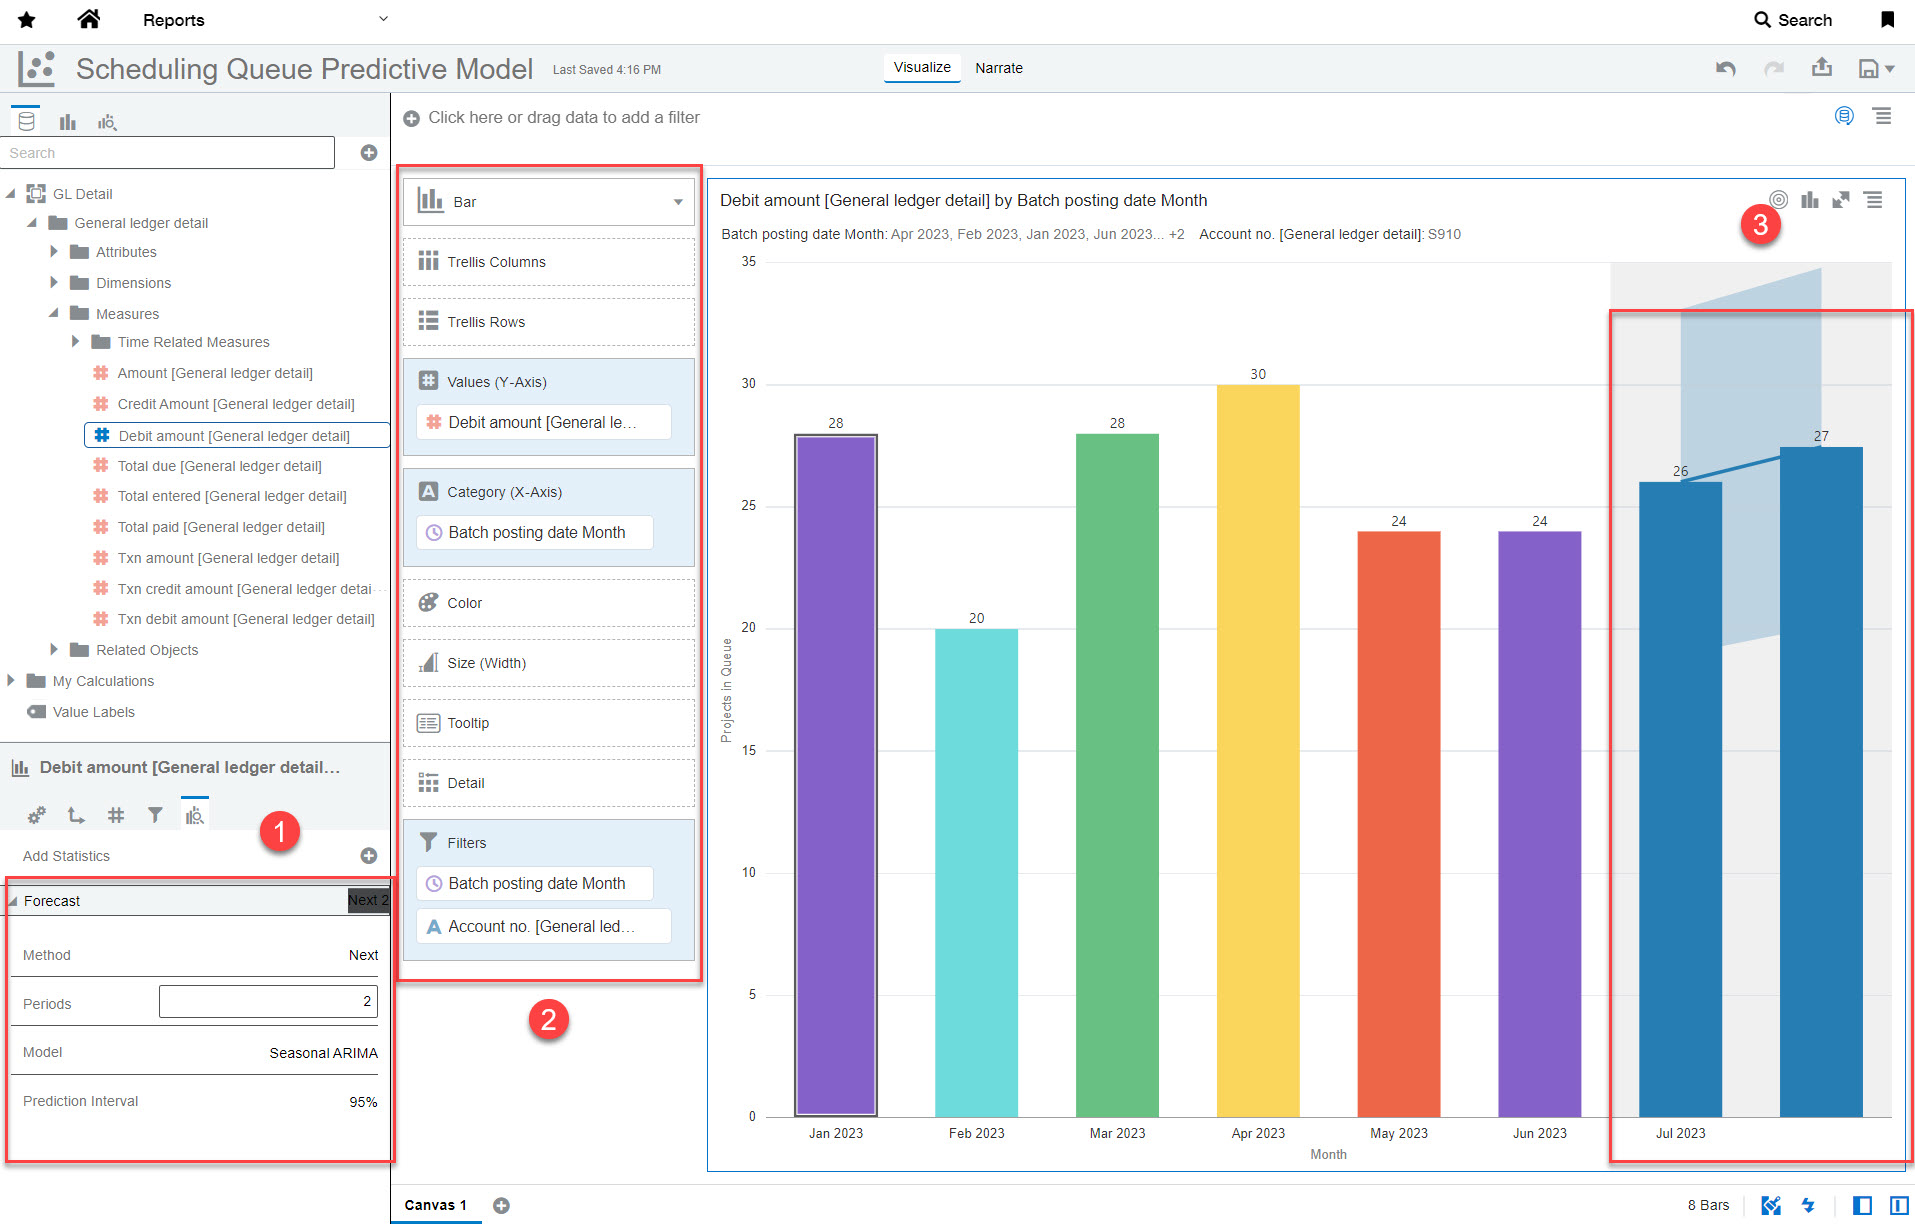
Let’s look at this statistical metric, closed won opportunities (new projects), over the last year to predict what we might be able to expect in terms of volume for the next two months with IVE.

- On the left, we’ve added a forecast and selected to see the newt two periods using the SQL Seasonal ARIMA model and a prediction interval of 95% (no SQL code necessary, though there is also an option add a formula leveraging a SQL function through calculations in IVE).
- In the middle section, we’ve defined the type of visualization (bar chart), X-axis (months), Y-axis (Debit amount), and Filters (just the statistical account S910 that captures total Admin Projects).
- At the far right, we see that based on the current year historical data and trends, the model has predicted 26 new projects for July and 27 in August with 95% certainty. (Note: this is just a small sample data set with not a huge range, the prediction might be different if we had larger variability).
While a prediction is only based on trends and historical data, it at least gives us a starting point. Assuming no event occurs that suddenly shocks the trend, and it continues on path, these could be valid starting points worth considering.
What’s Next?
Curious to learn more about IVE? Reach out to your CLA Sage Intacct team! Did you know CLA has a Digital practice and as part of it, Data Scientists that probably enjoyed MATLAB much more than I did? Check out our digital page and learn the interesting ways in which we’re helping clients, digitally.
The post Interactive Visual Explorer Forecasts – Future Predictions SQL appeared first on Sage Blog.
Contact us
Want to learn more? Complete the form below and we'll be in touch. If you are unable to see the form below, please complete your submission here.
